Boston's Rodent Action Plan
Making city data transparent and accessible through thoughtful design
Transforming complex civic data into accessible public resources
Boston's dense urban landscape presents unique challenges in managing rodent populations. The Boston Rodent Action Plan (BRAP) integrates data, technology, and community engagement to create cleaner, safer neighborhoods. I designed two webpages for the initiative to make Boston's rodent mitigation efforts transparent, data-driven, and engaging for residents.
From research to implementation
Research
Competitor Analysis
User Insights
Ideation
Information Architecture
Wireframing
Design
Visual System
Data Visualization
Bridging the gap between government data and public understanding
Residents felt disconnected from the city's rodent prevention efforts. Information about rodent activity, inspections, and prevention initiatives existed across multiple agencies but was not consolidated or easily understandable. The challenge was creating a clear, trustworthy, and interactive digital experience that helps residents understand ongoing rodent management efforts while building public trust through transparency.
Learning from NYC's data-driven approach
We looked at NYC's "Rat Mitigation Zones" dashboard as a strong reference for civic data visualization. Their approach demonstrated several key principles that informed our design direction.
NYC's Rat Mitigation Zones Dashboard
A two-page experience: storytelling meets data
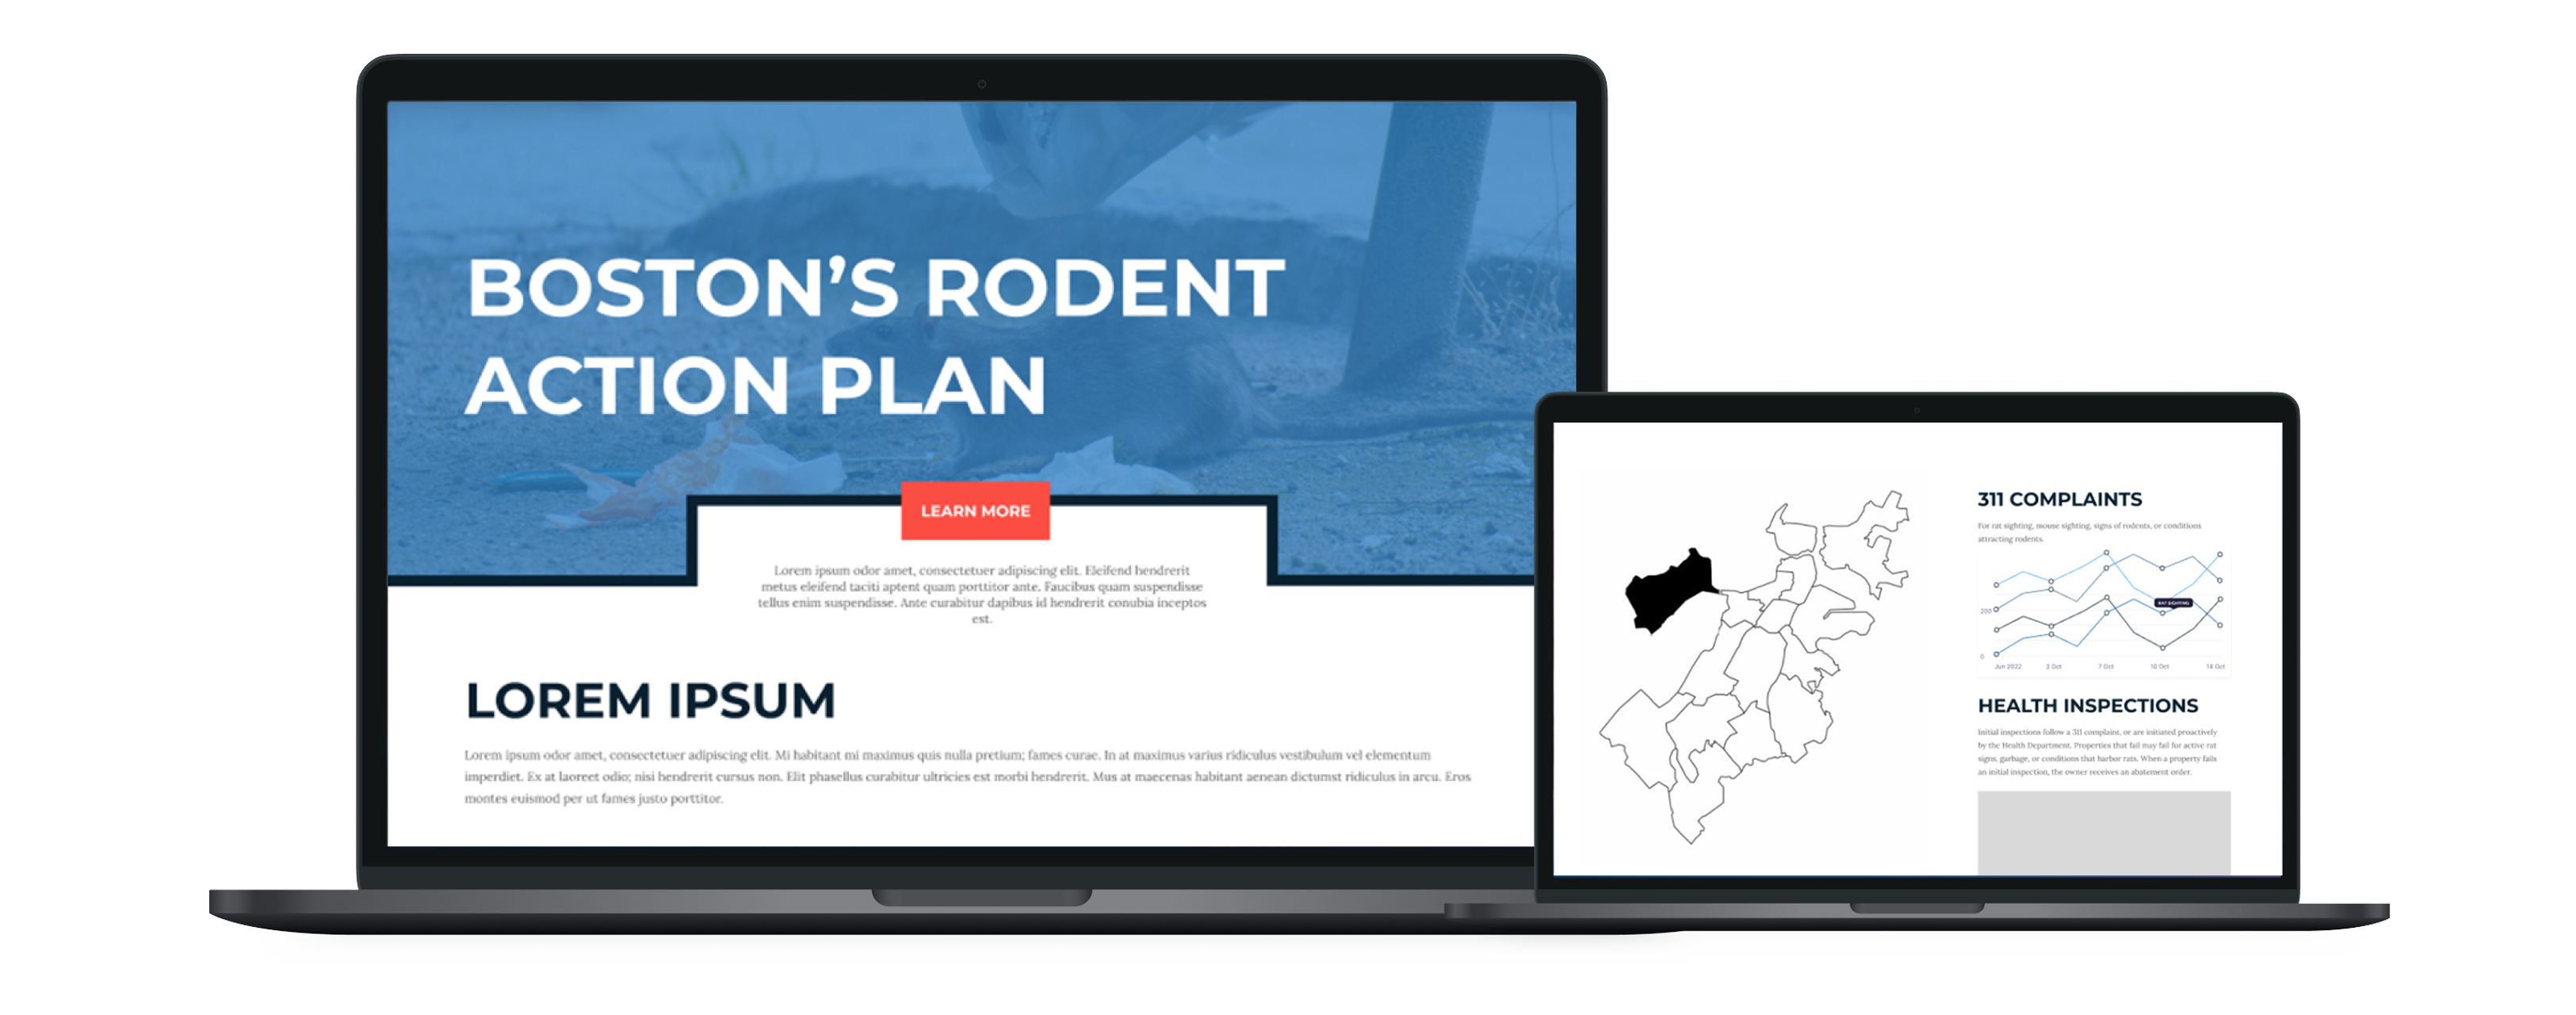
Action Plan Page: Introduces BRAP's mission and strategies using clear information hierarchy, civic typography, and supportive imagery to make policy-level information approachable.
Dashboard Page: Visualizes real-time data from multiple divisions within Boston's Inspectional Services Department, featuring an interactive Boston map showing neighborhood-level rodent activity, data visualizations for 311 complaints and inspections, and a clean modular layout enabling drill-down by zone.
The design balances data density with readability, ensuring the interface feels approachable for the public while remaining informative for policy researchers.
Key Research Insights
- Spatial zones where rat control is emphasized, letting users choose a zone and see complaint, inspection, and control data
- Clean tiered information: map first, then overlay of metrics
- Balance between data density and clarity
Through this research, I found that users valued neighborhood-level visibility over citywide averages, interactive visuals rather than dense reports, and transparency about city actions.


Setting a foundation for civic transparency
The project successfully delivered a modern dashboard experience that bridges the gap between complex government data and public accessibility.
- Created a consistent visual identity for BRAP within Boston's civic brand system
- Improved public accessibility to complex city data through interactive neighborhood-level visualization
- Established a clear information flow from policy overview to data insights
- Set a foundation for future city dashboards leveraging sensor and environmental data
Designing for civic responsibility
This project taught me how to balance creative problem, solving with civic responsibility. Working with MONUM gave me insight into designing for a client, from everyday residents to policy researchers, and the importance of making government data both transparent and actionable.
I learned that effective civic design isn't just about aesthetics; it's about building trust through clarity, accessibility, and thoughtful information architecture that serves the public good.
 Previous Project
